EO Care
Clinician-Guided Symptom Care, Reaching Hundreds of Patients
EO's care plan is a free, clinician-guided cannabinoid care plan for pain, sleep, anxiety and nausea, whether they come from cancer treatment, age or a chronic condition. I've led its product design since 2023, now as Associate Director, Product & Experience: the patient journey end to end, the words in the plan, the check-ins that keep it right, and the clinician views behind it. What shipped is a plan that changes with the patient, and the loop that proves it.
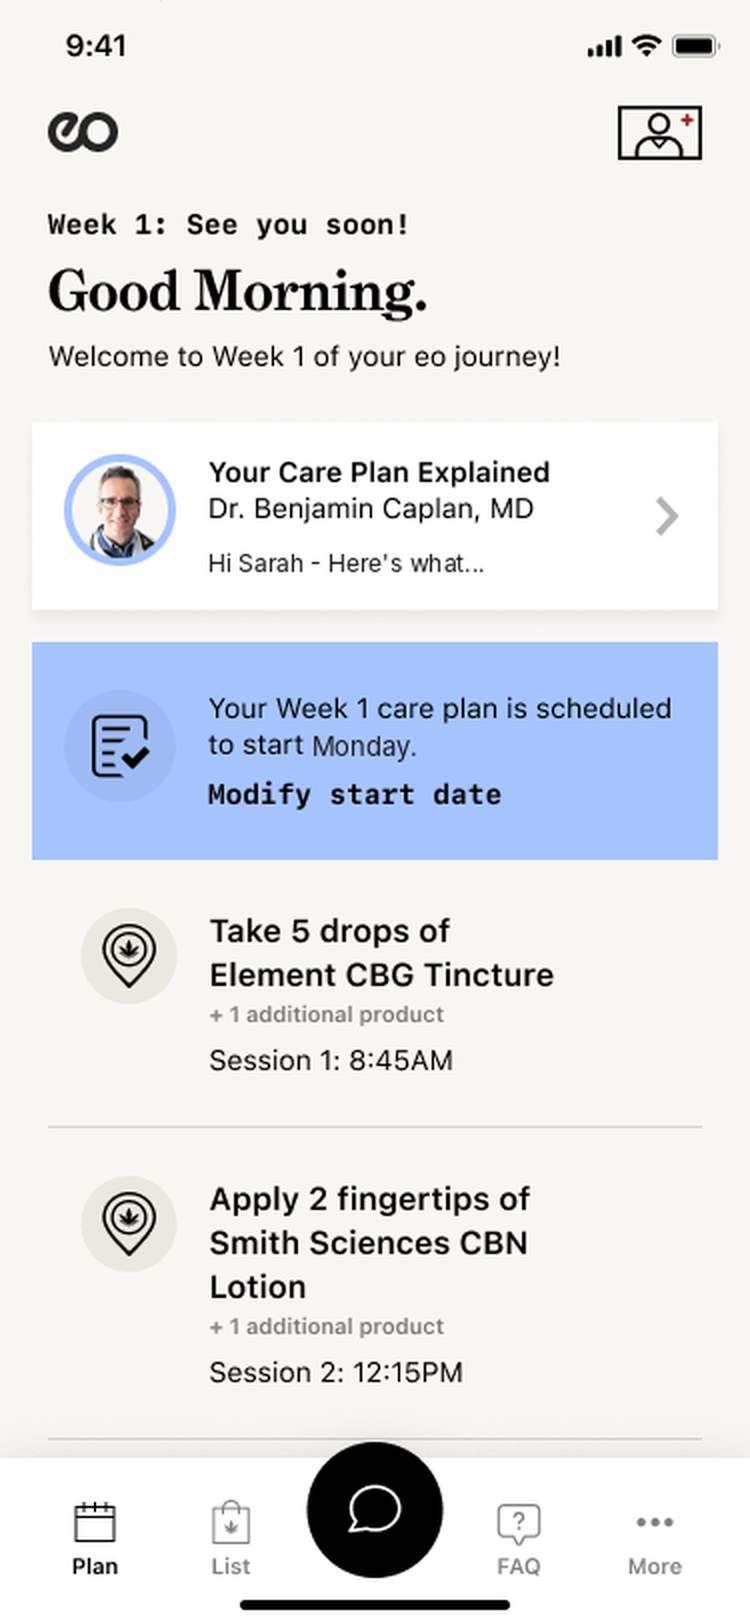
iOS appA week-by-week plan in timed dose sessions
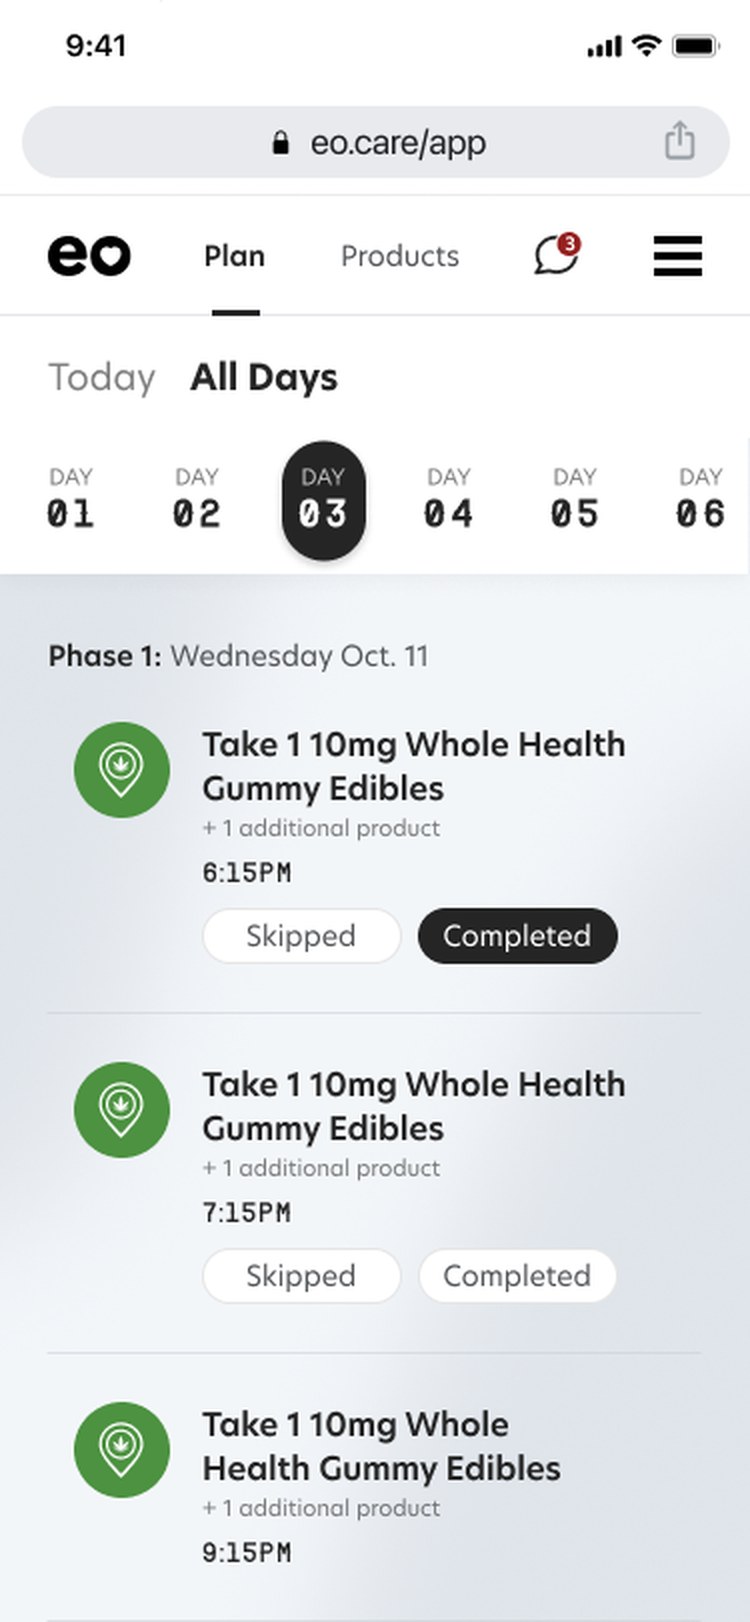
eo 3.0Plan and Products tabs, doses day by day
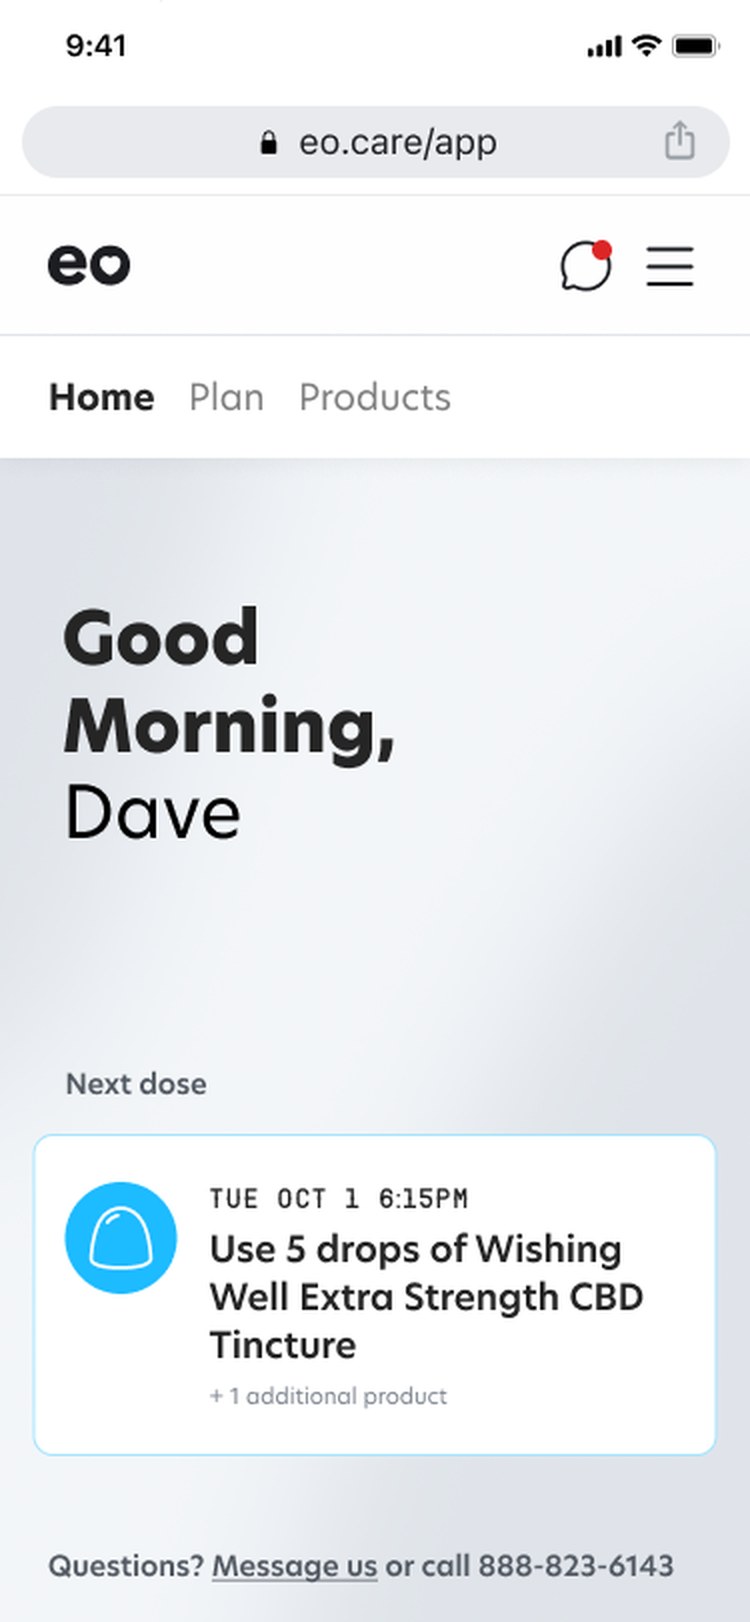
Web appIn the browser, the next dose up front
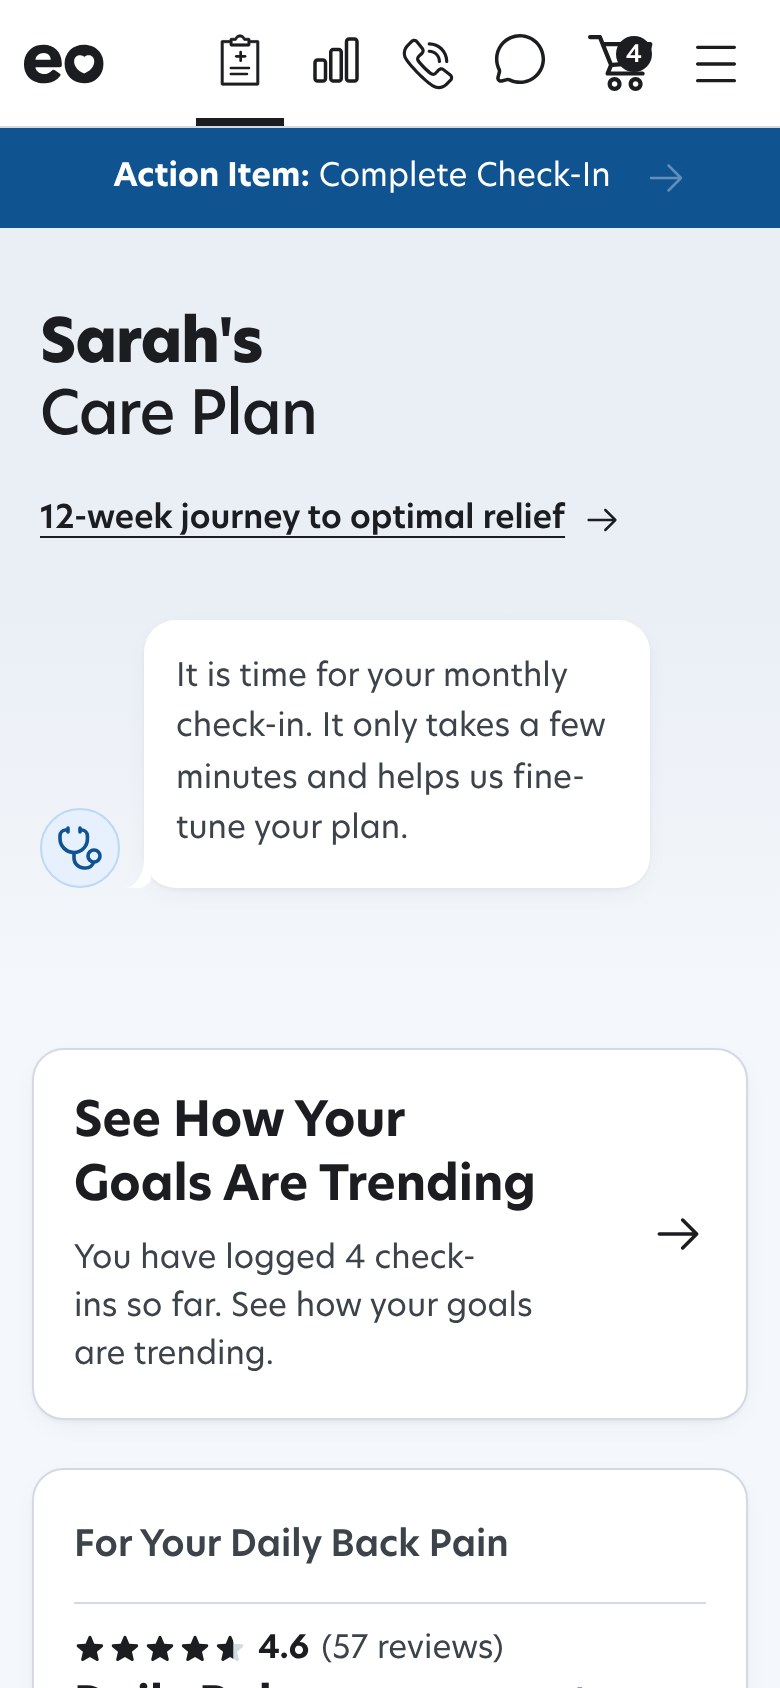
TodayA plan that changes with her
of patients on the plan: adults in cancer care and survivorship, and older adults managing pain, sleep, stress and nausea
cancer centers whose clinicians refer in: MSK, Penn, Jefferson, Inova, Northwell, Mayo Clinic, Mount Sinai and UVA Health
to every patient since October 2025. The guidance is free; the products are sold
The problem
A Plan That Never Changed Didn't Work
People managing these symptoms, from pain and neuropathy to sleep, nausea and anxiety, mostly try cannabinoids on their own, with nobody watching the dose or the interactions. EO's first version fixed that with a clinician-designed plan. But the plan was static, and three things in the data said static wasn't enough.
34.6% relief when the plan never changed
Static Plans Rarely Landed
In EO's ASCO 2026 data, patients whose plan never changed reported significant relief 34.6% of the time. When the plan changed three or more times: 96.6%.
"No changes needed," the most common reply
The Feedback Ask Produced No Signal
One survey, six data domains, every 30 days on a fixed clock. The most common reply told the clinician nothing and gave the patient no reason to answer the next one.
17% ever reached the checkout button
Patients Couldn't Act on the Plan
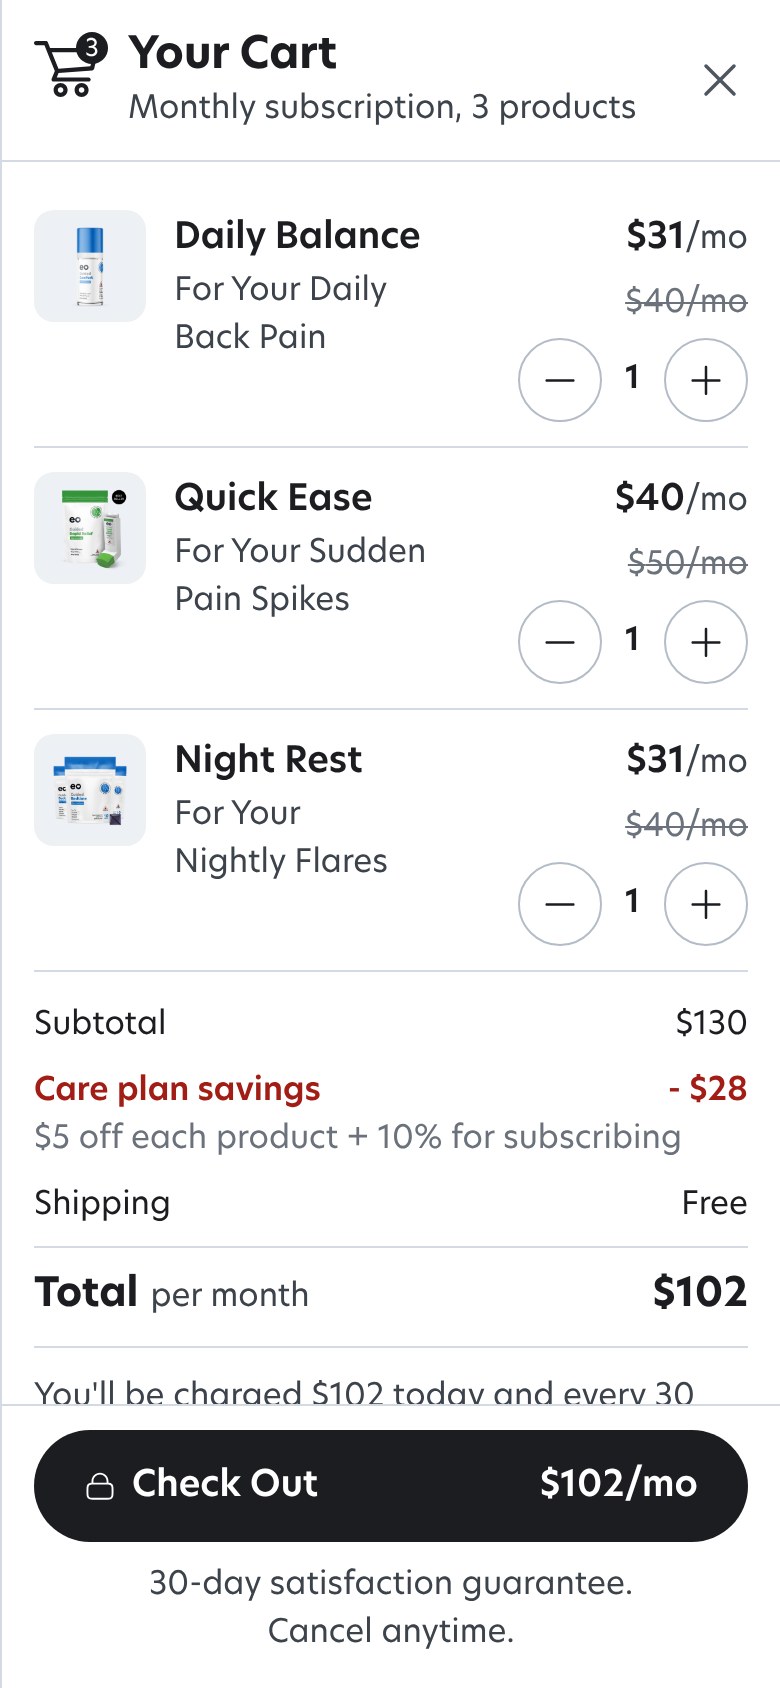
89% viewed the plan on a phone, the only checkout button sat about 4,100 pixels down the page, and 17% of viewers ever reached it. One in twenty went on to buy.
Funnel figures from EO's analytics, September 9 to October 6, 2026, and a conversion review with the CEO on October 8. Directional, not a controlled test.
The solution
Three Decisions That Shaped It
One idea under all of them: the plan is a loop, not a document. Profiling scores each symptom on a PROMIS instrument, the plan carries its reasoning, the check-in asks only for what has gone stale, and every loop closes with a change the patient can see. Each decision was built as a working prototype in code and put in front of the clinical lead and patients before engineering built it, so the questions a mockup can't answer, does she tap it, read it, scroll past it, got answered early.
The loop every decision serves
1. Profile
Up to three concerns, each scored on its PROMIS block. Two activities in the patient's own words.
2. Plan
Products, dose and the reasoning, written for this patient. A clinician reviews when a trigger says so.
3. Check in
Only what has gone stale: relief per product, side effects, a PROMIS re-rate.
4. Adjust, visibly
Confirmed, tuned or escalated, shown to the patient, and back to step 3.
Decision 1
The Model Carries Its Reasoning, the LLM Translates
Easy to Distrust, Easy to Misread
A dosed cannabinoid plan is both. Patients needed to know why each product was chosen and exactly how to take it, in words written for them, without a language model ever deciding anything clinical.
The Model Decides. The LLM Translates.
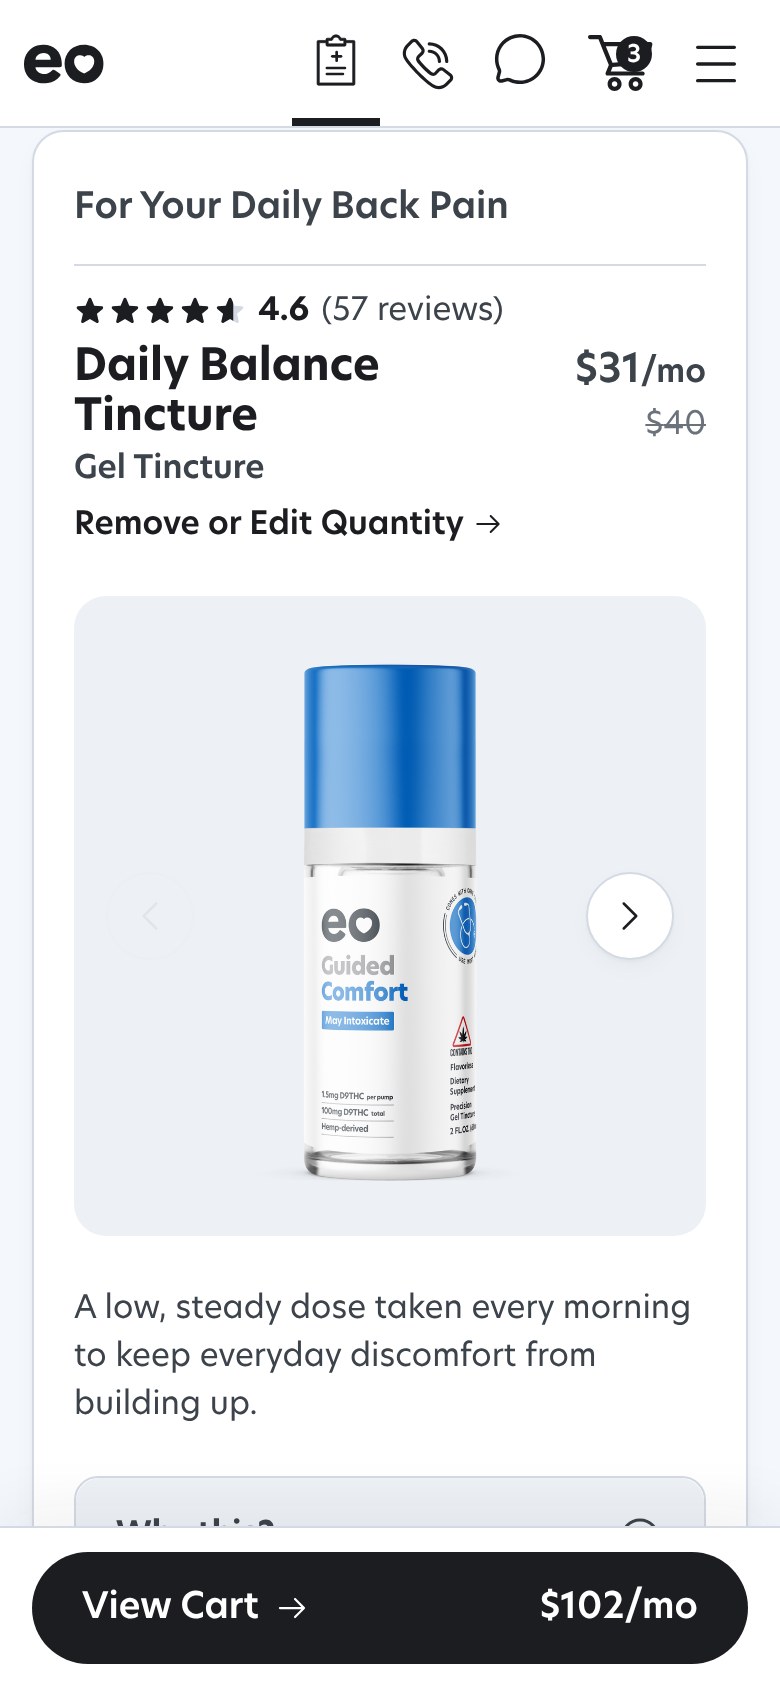
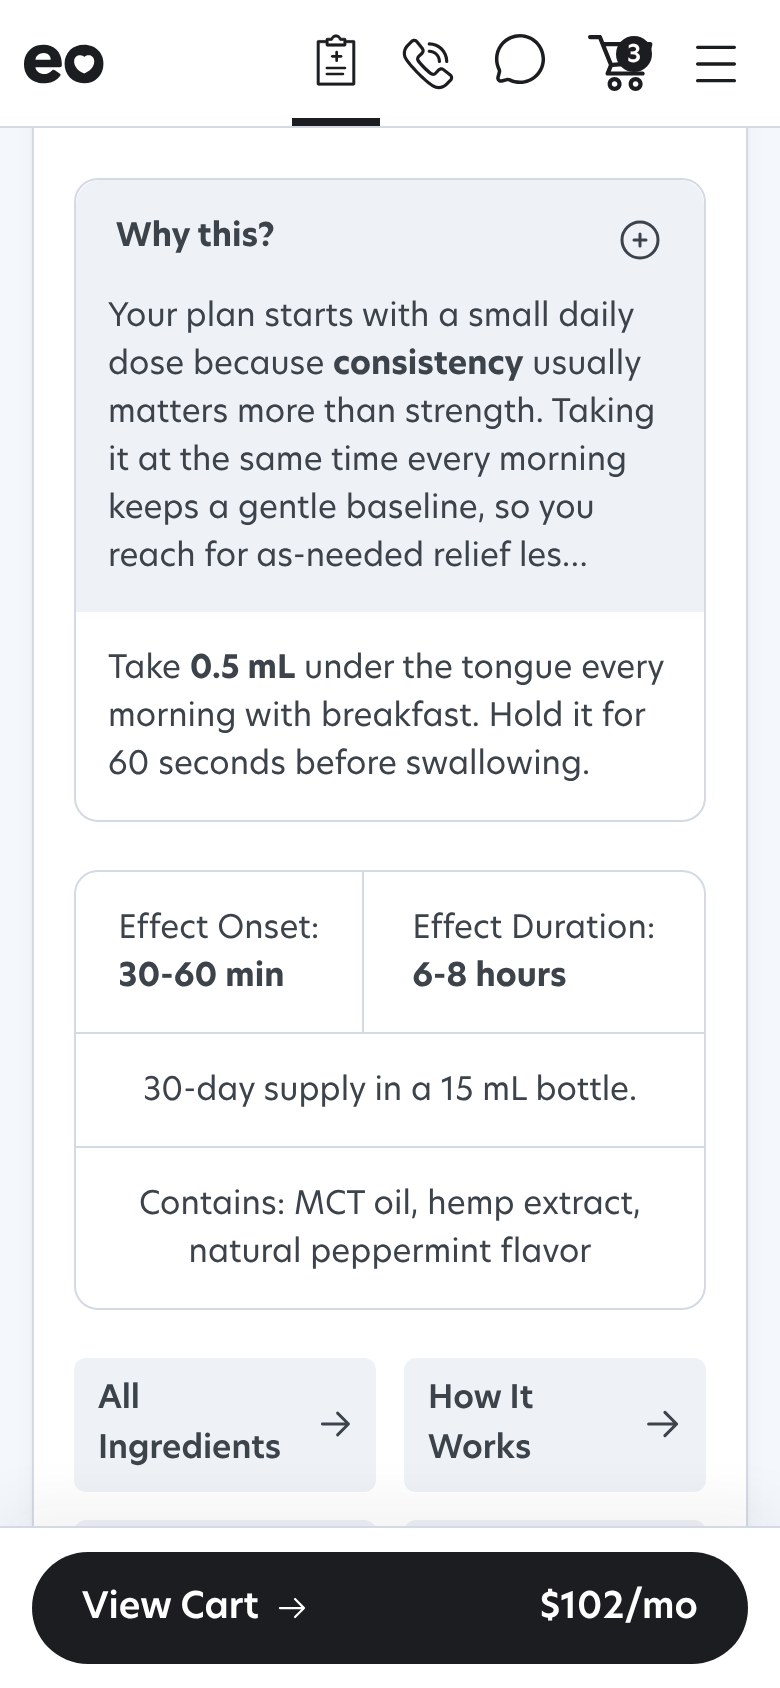
Every product card carries a "Why this?" written for that patient, the dose, and when to expect it to work. One standing rule governs the words: the model decides the product and dose, the LLM narrates only what was decided, every number verbatim, with a template fallback if the output fails validation.
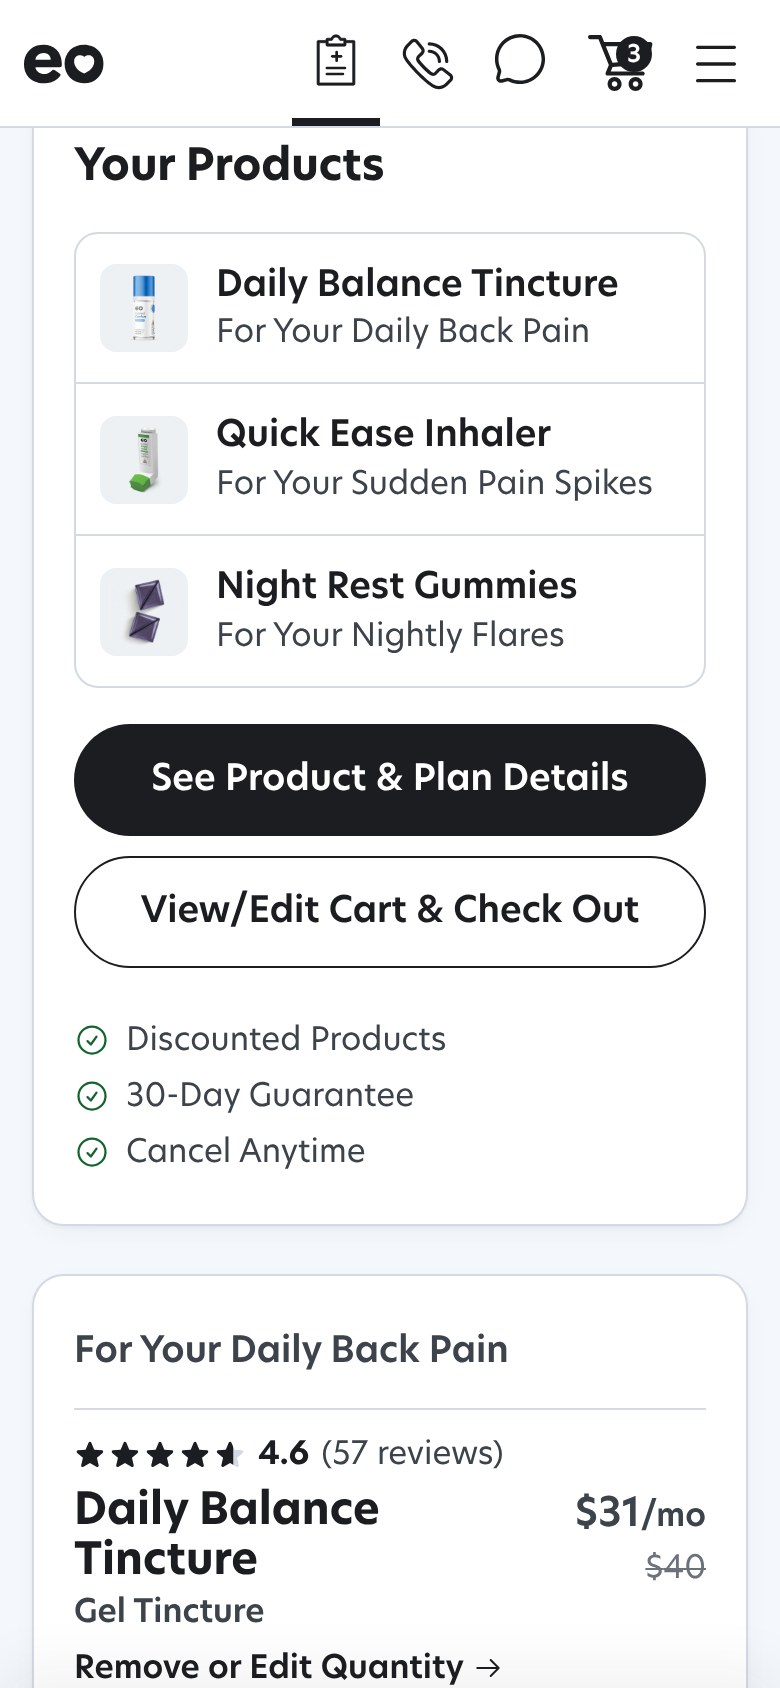
1Your Products, right under the care team's note: each product named for the symptom it's for, and two ways forward.
Decision 2
Feedback Is a Loop, Not a Survey
A Big Ask on an Arbitrary Clock
One survey every 30 days is the worst combination for completion, and a survey that produces no visible change gives the patient no reason to answer the next one.
Three Layers, Only What's Stale, Every Loop Closes
A weekly pulse of one relief question per product, a two-week check-in that asks only for what has gone stale, and a two-month deep tune framed as a progress review. A red flag goes straight to outreach, and every loop closes visibly: confirmed, tuned or escalated.
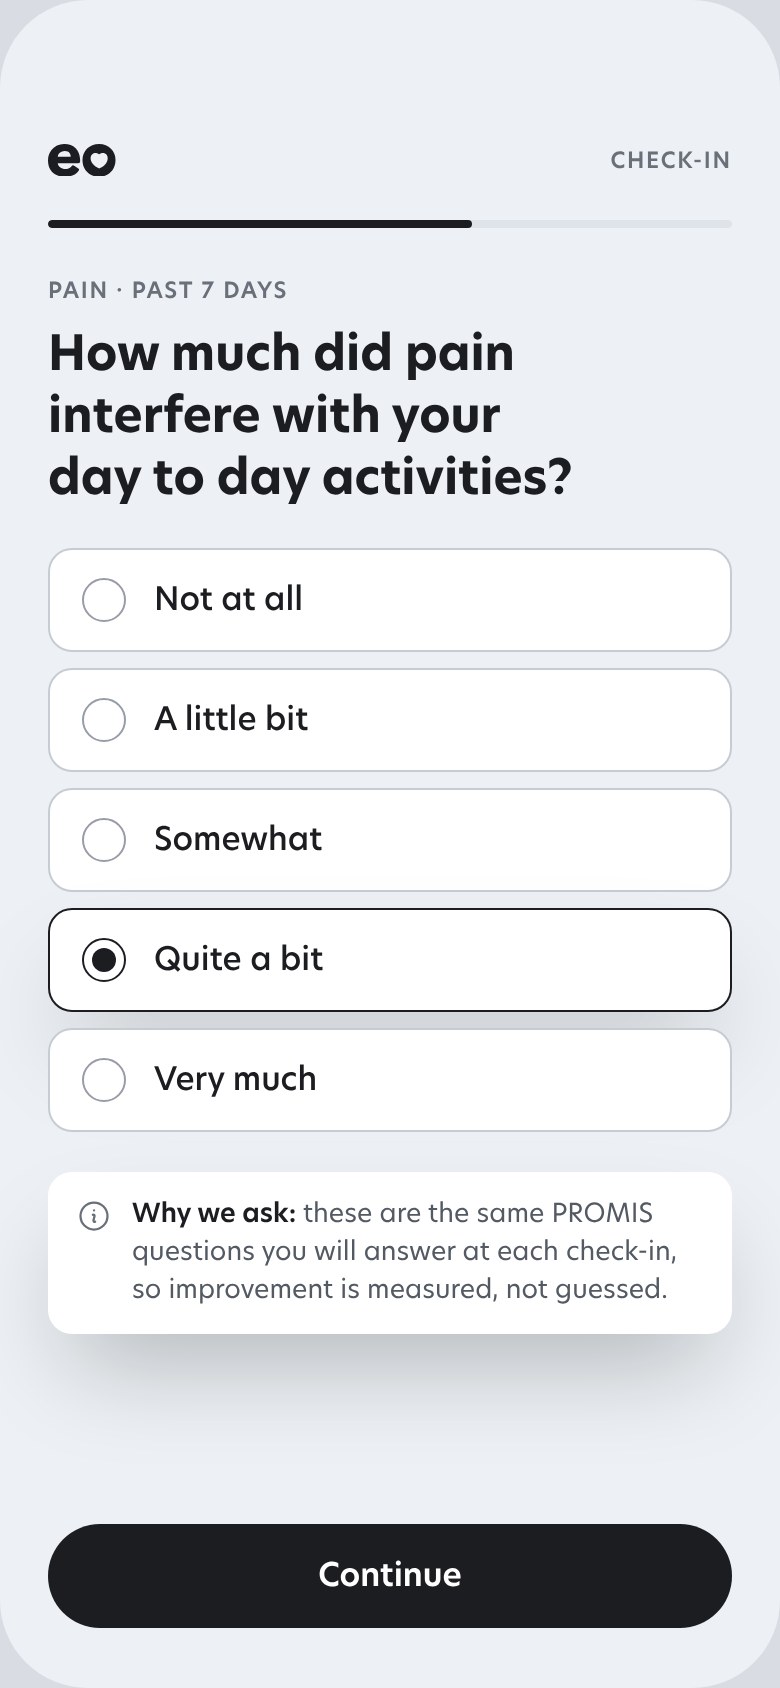
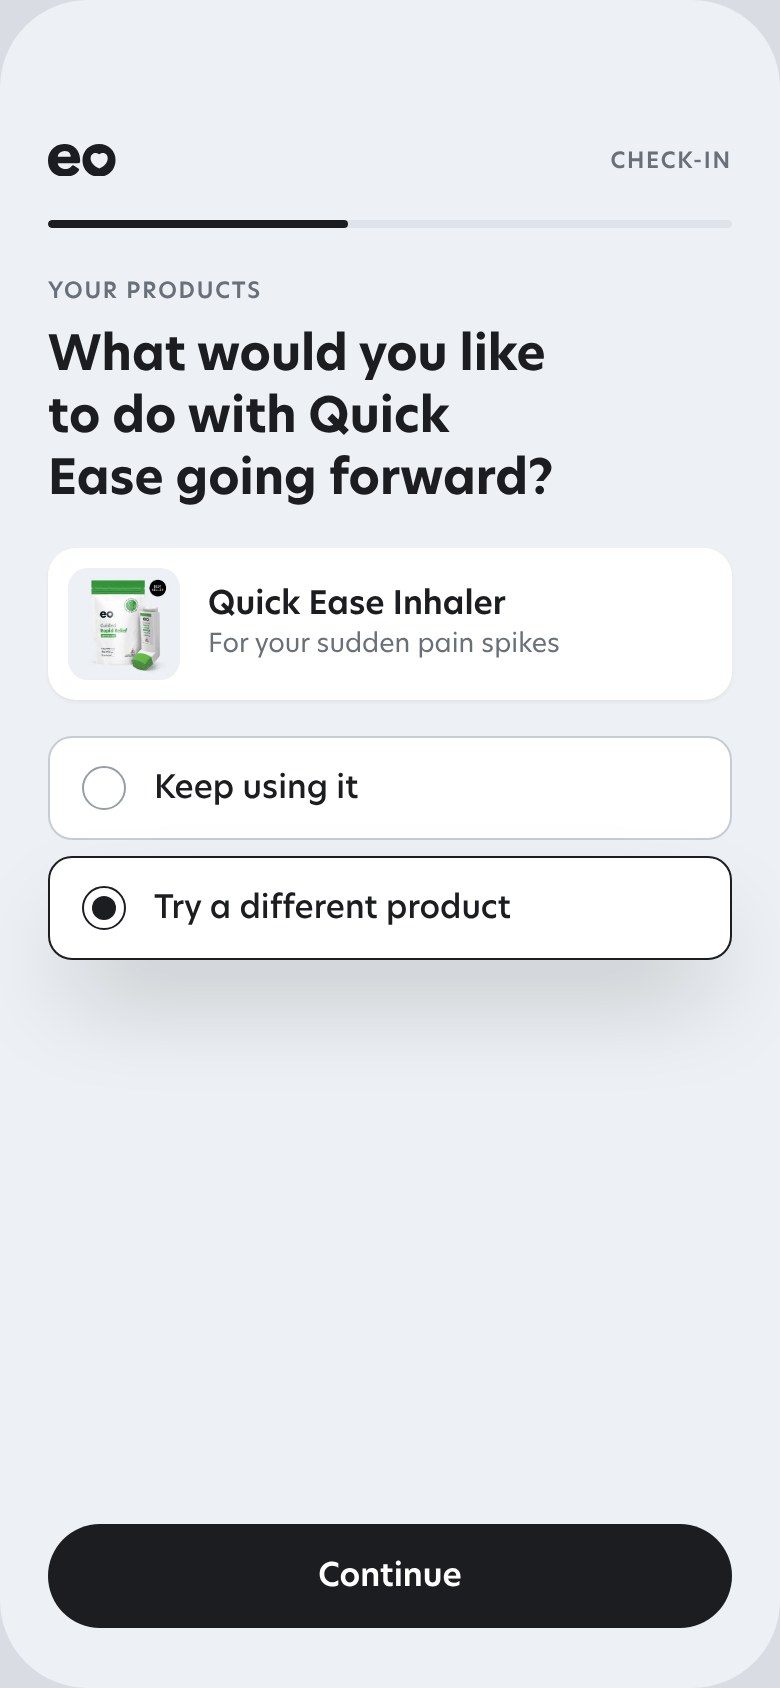
1The same PROMIS questions she answered at intake, so improvement is measured, not guessed.
2Keep it or try something else, one product at a time. That answer is what changes the plan.
Decision 3
Progress the Patient Can See, Measured, Not Described
A Plan That Adjusts Quietly Feels Like Nothing Happened
And "how are you feeling?" can't be compared to last month. The patient needed to see the loop working, and the data needed to be comparable.
Their Goals, Their Words, a Chart With Them on It
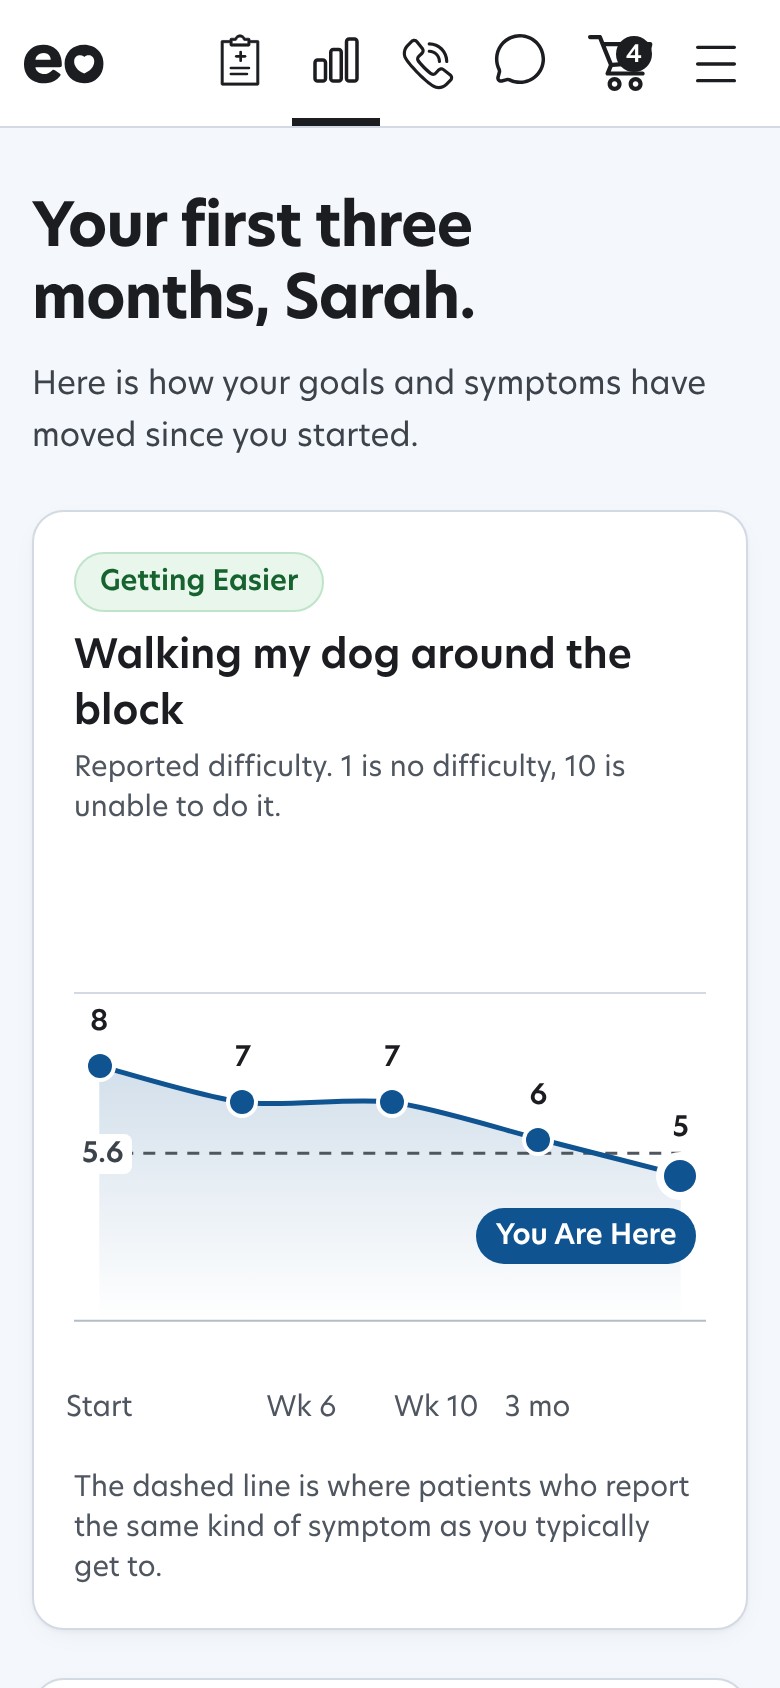
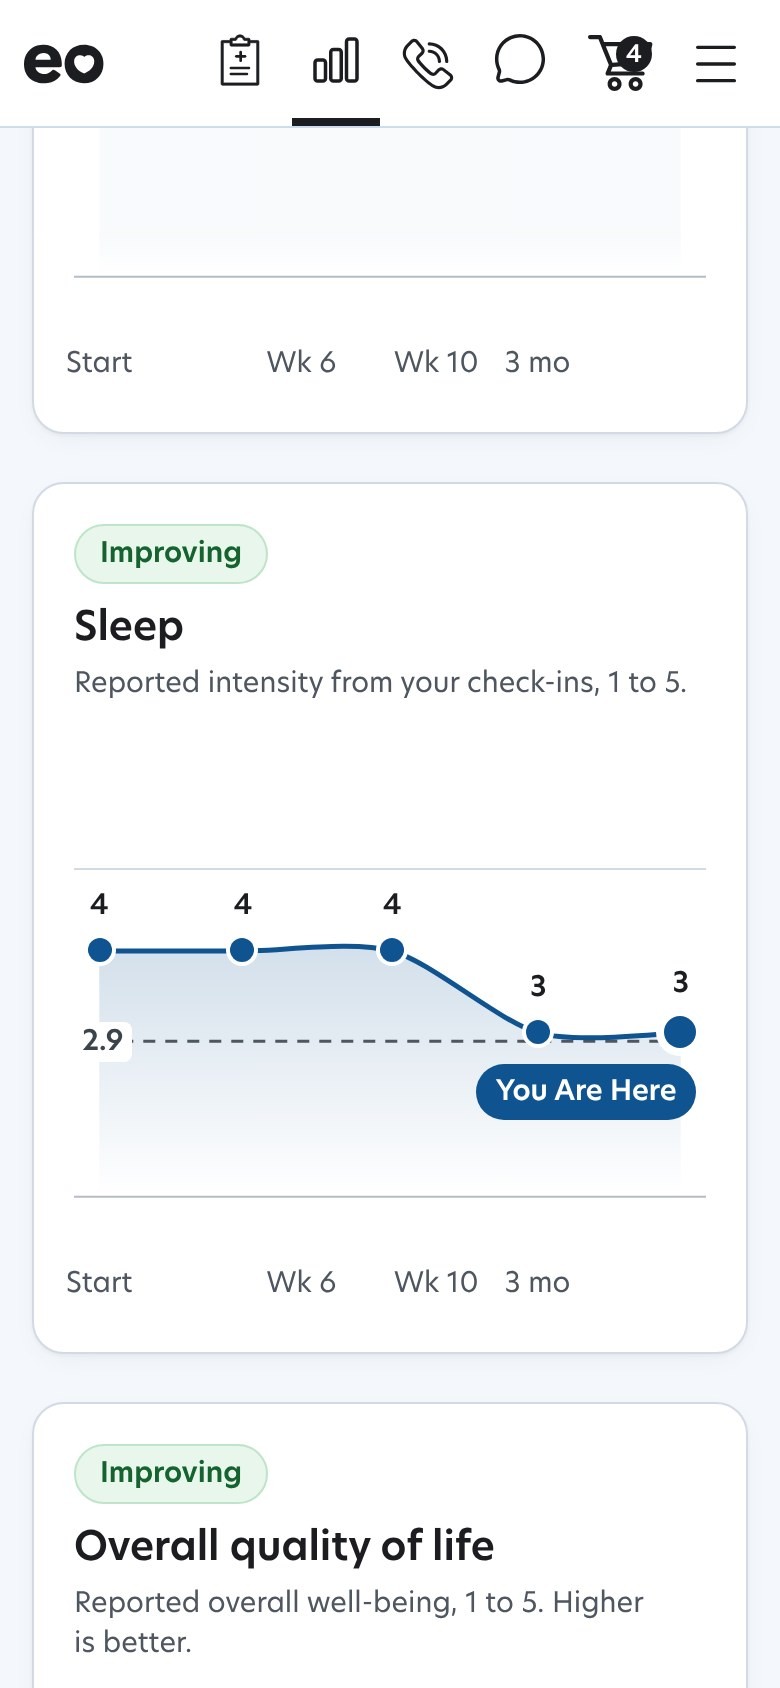
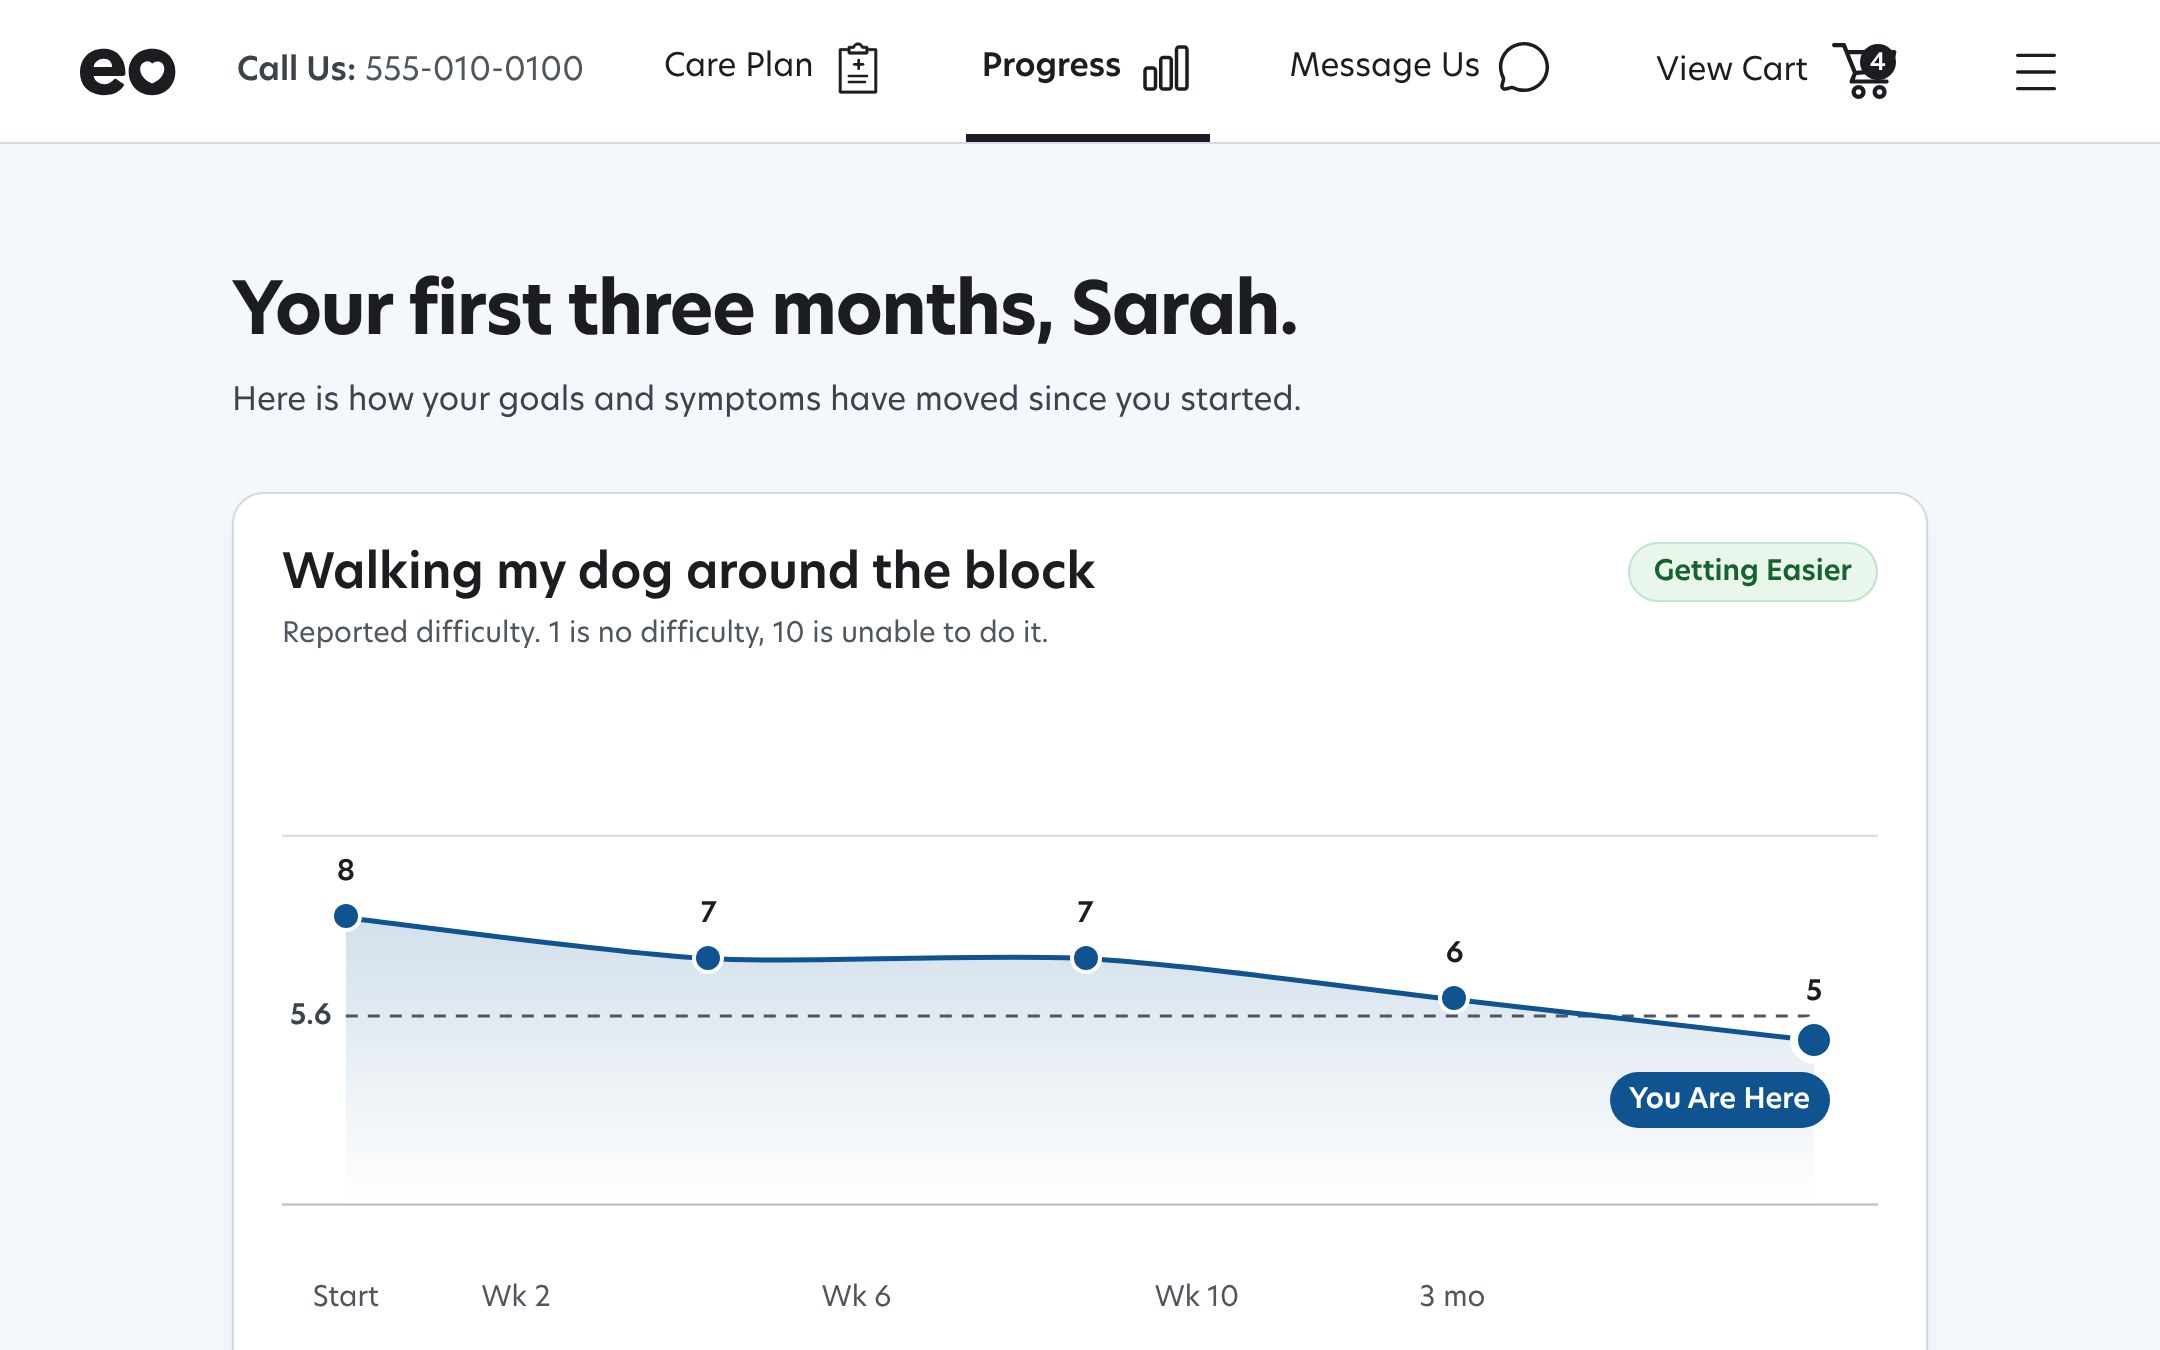
At intake the patient names up to two activities in their own words and rates the difficulty. The plan then opens on how those goals are trending, and every check-in ends on a chart with a new dot, a target drawn from patients like them, and "You are here."
How I work now
In the last year my workflow moved from Figma to code. I build the screen as working software, test it with clinicians and patients, and push the PR.
Engineering reviews working code instead of translating a mockup. Every screen on this page is a capture of one of those builds, and the next section is what testing them found.
Validation and iteration
Five Rounds With the Clinical Lead
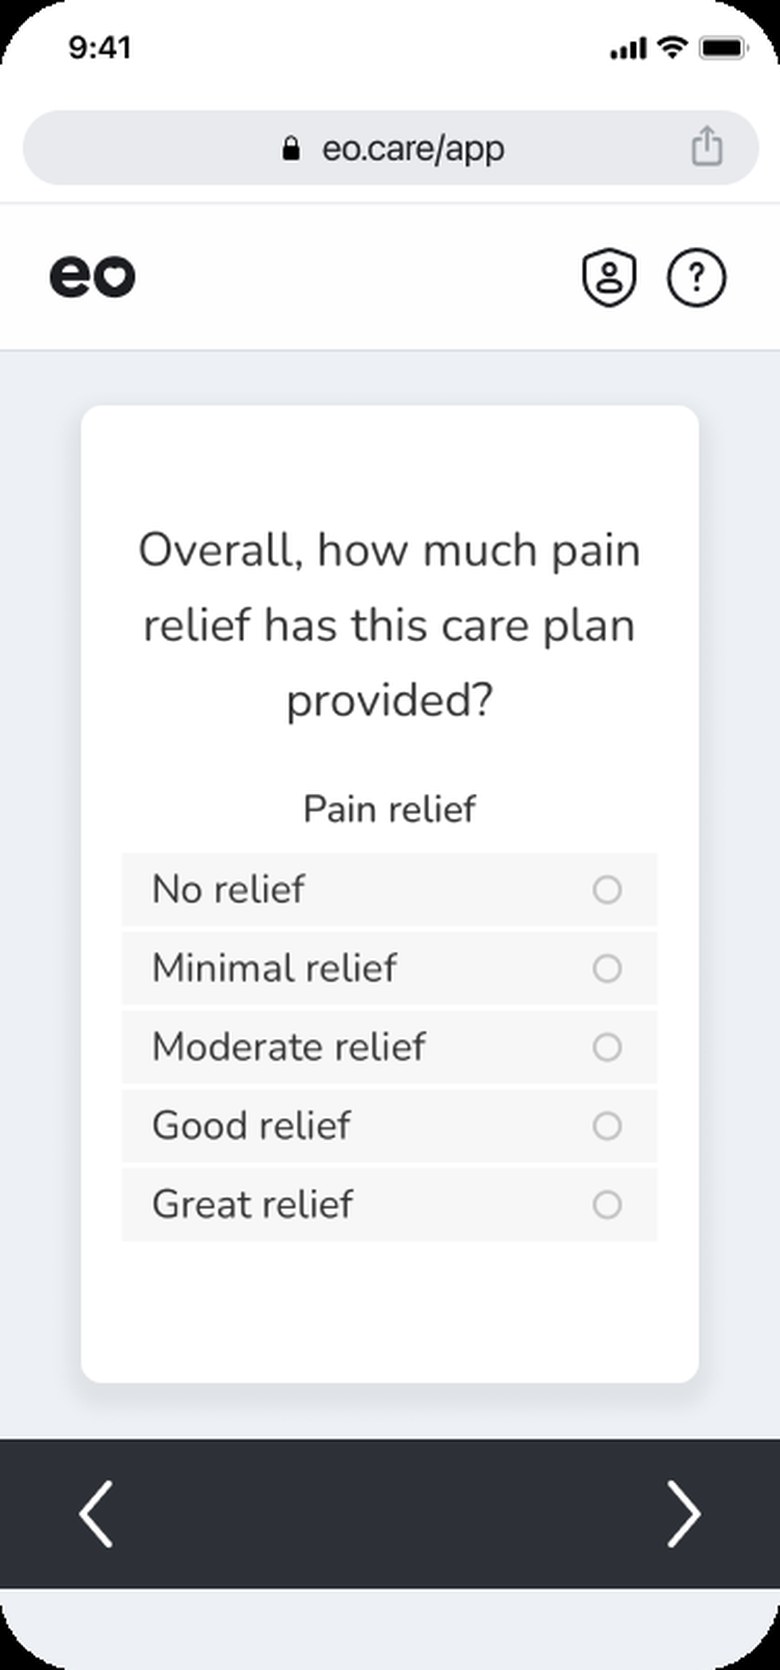
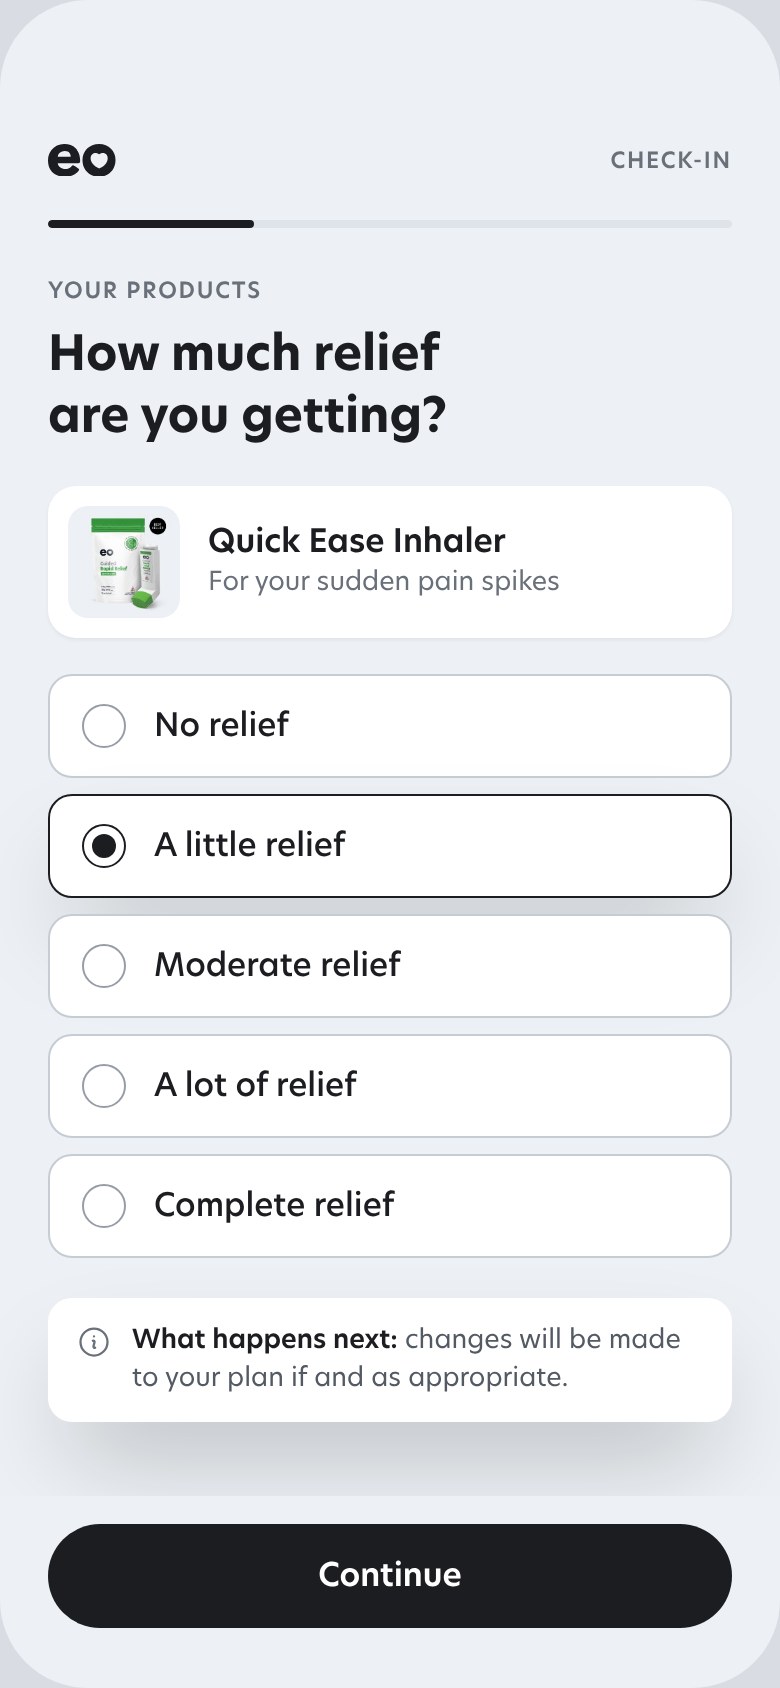
The check-in went through five rounds with the clinical lead on the working build, before engineering touched it. The old one asked how much relief the whole plan had given, and “No changes needed” was the most common reply. The new one asks product by product, only for what has gone stale, and sends a red flag straight to outreach.
What I built
The check-in as a working front end, trued up question by question against the live survey. Five rounds with the clinical lead before engineering built it.
What we observed
“No changes needed” was the most common reply. One rating for the whole plan couldn’t say which product wasn’t working, so the clinician had nothing to change.
What changed
Relief asked per product, only what has gone stale, side effects by product form on a five-point intensity scale, and a red flag straight to outreach.
Does Asking Less Keep People Answering?
The bet behind the redesign is that people keep answering a question they have seen acted on. The read is completion across successive check-ins, and how often an answer leads to a plan change.
Which Product Should Lead the Plan?
Per-product answers show which products patients keep and which they swap, so the next loop asks whether the plan should open with the essential product and offer the rest.
Impact
The Platform Captures the Data and Acts on It. The Data Is the Proof.
Every check-in captures a data point, scored on the instruments a clinical trial would use, and the loop acts on it with a change the patient can see. The figures below are clinical outcomes from routine care, observational and single-arm: they show what patients on the plan reported, not that the design alone caused it. The engagement figures live in the validation section above.
The more often a patient's plan was adjusted, the more likely they were to feel better.
EO's ASCO 2026 abstract, 136 cancer patients. Each row is a group of patients; each dot is 10% of that group, filled when they reported significant relief. Every adjustment came through the check-in loop above.
Plan never changed
34.6% felt significant relief
Plan changed 1 or 2 times
72.4% felt significant relief
Plan changed 3 or more times
96.6% felt significant relief
Patients whose plan changed three or more times were nearly three times as likely to feel significant relief as patients whose plan never changed, and side-effect burden fell as plans evolved.
Also observed, same platform, same instruments
What These Numbers Are, and Aren't
- Observational, single-arm data from routine care, not a randomized trial, in a population that skews older and toward cancer
- The PROMIS and ER figures are from EO's June 2026 data pull and the public outcomes page I designed
- The checkout fix and the progress view are in build, so their effect isn't measured yet; the clinician dashboard is a proposal
What I'd Do Sooner
- Instrument the plan page on day one. The biggest fixes of the year came from numbers we only had in October
- Start the public outcomes page earlier. Defining the metrics for it forced the shared definitions everything else now reads from
- Keep prototyping in code. Nothing moved a decision faster than a clinician using the real thing
ASCO 2026 abstract by Brooke Worster, Gregory Garber and Kristen Parton, 136 cancer patients (abstract, poster, EO’s summary); a follow-on abstract was accepted by the American Oncology Network. I’m not an author on either: the data came from the care plan, check-ins and outcomes view I designed. ER benchmark: Kolodziej et al., J Oncol Pract 2011.
Interested in talking through this project?